Scenario:
You need to debug an existing PHP site (wordpress, joomla, drupal, etc..), and you find it very difficult/time-consuming to set up your development IDE to simulate the deployed environment.
You want to have a quick look of what's actually going on, directly from the SSH terminal.
TL;DR
Use xdebug to intercept PHP scripts, and communicate with vdebug via dbgp.
(Please ignore the rest of article if you are not comfortable with vim - the editor).
Full Flow:
1. Install xdebug (The following assumed Ubuntu 16.04)
|
1 |
pecl install xdebug |
You should see the following the end of installation:
Build process completed successfully

Installing '/usr/lib/php/20131226/xdebug.so'

install ok: channel://pecl.php.net/xdebug-2.5.5

configuration option "php_ini" is not set to php.ini location

You should add "zend_extension=/usr/lib/php/20131226/xdebug.so" to php.ini
2. Per instruction, put the line of zend_extension=/usr/lib/php/20131226/xdebug.so into php.ini (use locate php.ini to find the correct files):
|
1 2 |
echo zend_extension=/usr/lib/php/20131226/xdebug.so >> /etc/php/5.6/apache2/php.ini echo zend_extension=/usr/lib/php/20131226/xdebug.so >> /etc/php/5.6/cli/php.ini |
3. Append the xdebug related configurations into the php.ini as well:
|
1 2 3 4 5 6 7 |
xdebug.profiler_output_dir = "/tmp/xdebug/" xdebug.profiler_enable = On xdebug.remote_enable=On xdebug.remote_host="localhost" xdebug.remote_port=9000 xdebug.remote_handler="dbgp" xdebug.remote_autostart = 1 |
4. Do a brief experiment, using debugclient from xdebug:
|
1 2 3 4 |
git clone https://github.com/xdebug/xdebug cd xdebug/debugclient make ./debugclient |
And you see the following prompt:
user@dev:~/temp/xdebug/debugclient# ./debugclient Xdebug Simple DBGp client (0.11.0) Copyright 2002-2017 by Derick Rethans. - libedit support: enabled
Creating a socket for IPv4.
Waiting for debug server to connect on port 9000.
5. browse any php file hosted by apache
6. if you see the following from debug client, the xdebug configuration could be correct now.
Connect

<xml version="1.0" encoding="iso-8859-1">;

<init xmlns="urn:debugger_protocol_v1" xmlns:xdebug="http://xdebug.org/dbgp/xdebug" fileuri="file:///var/www/index.php" language="PHP" xdebug:language_version="5.6.31-1~ubuntu1...

(cmd)
Now, xdebug is able to intercept the php script execution, and pass out the control using DBGP. Let's shut down the xdebug client now with Ctrl-C. (The debugclient is only used for experiments).
7. In the server install vim that's compiled with python 2, note that currently vdebug does not work with the regular latest vim.
|
1 |
apt install vim-nox |
Verify it's vim with python2 instead of python3
|
1 |
vim --version | grep python |
The result should be this:
+cryptv +linebreak +python +vreplace +cscope +lispindent -python3 +wildignore
8. Install pathgon
|
1 2 |
mkdir -p ~/.vim/autoload ~/.vim/bundle && \ curl -LSso ~/.vim/autoload/pathogen.vim https://tpo.pe/pathogen.vim |
9. Install vdebug
|
1 2 |
cd ~/.vim/bundle git clone https://github.com/joonty/vdebug |
10. Use vim to edit the php you would like to debug:
|
1 |
vim /var/www/test.php |
11. Press F5 in the vim, you should see the prompt:
Waiting for a connection (Ctrl-C to cancel, this message will self-destruct in 20 seconds...)
12. Use browser to trigger the php file (it's fine if the target file is only included in from other php). The browser is supposed to hang.
13. The magic should happen inside the vim now, you should see something like this, inside the vim of terminal:
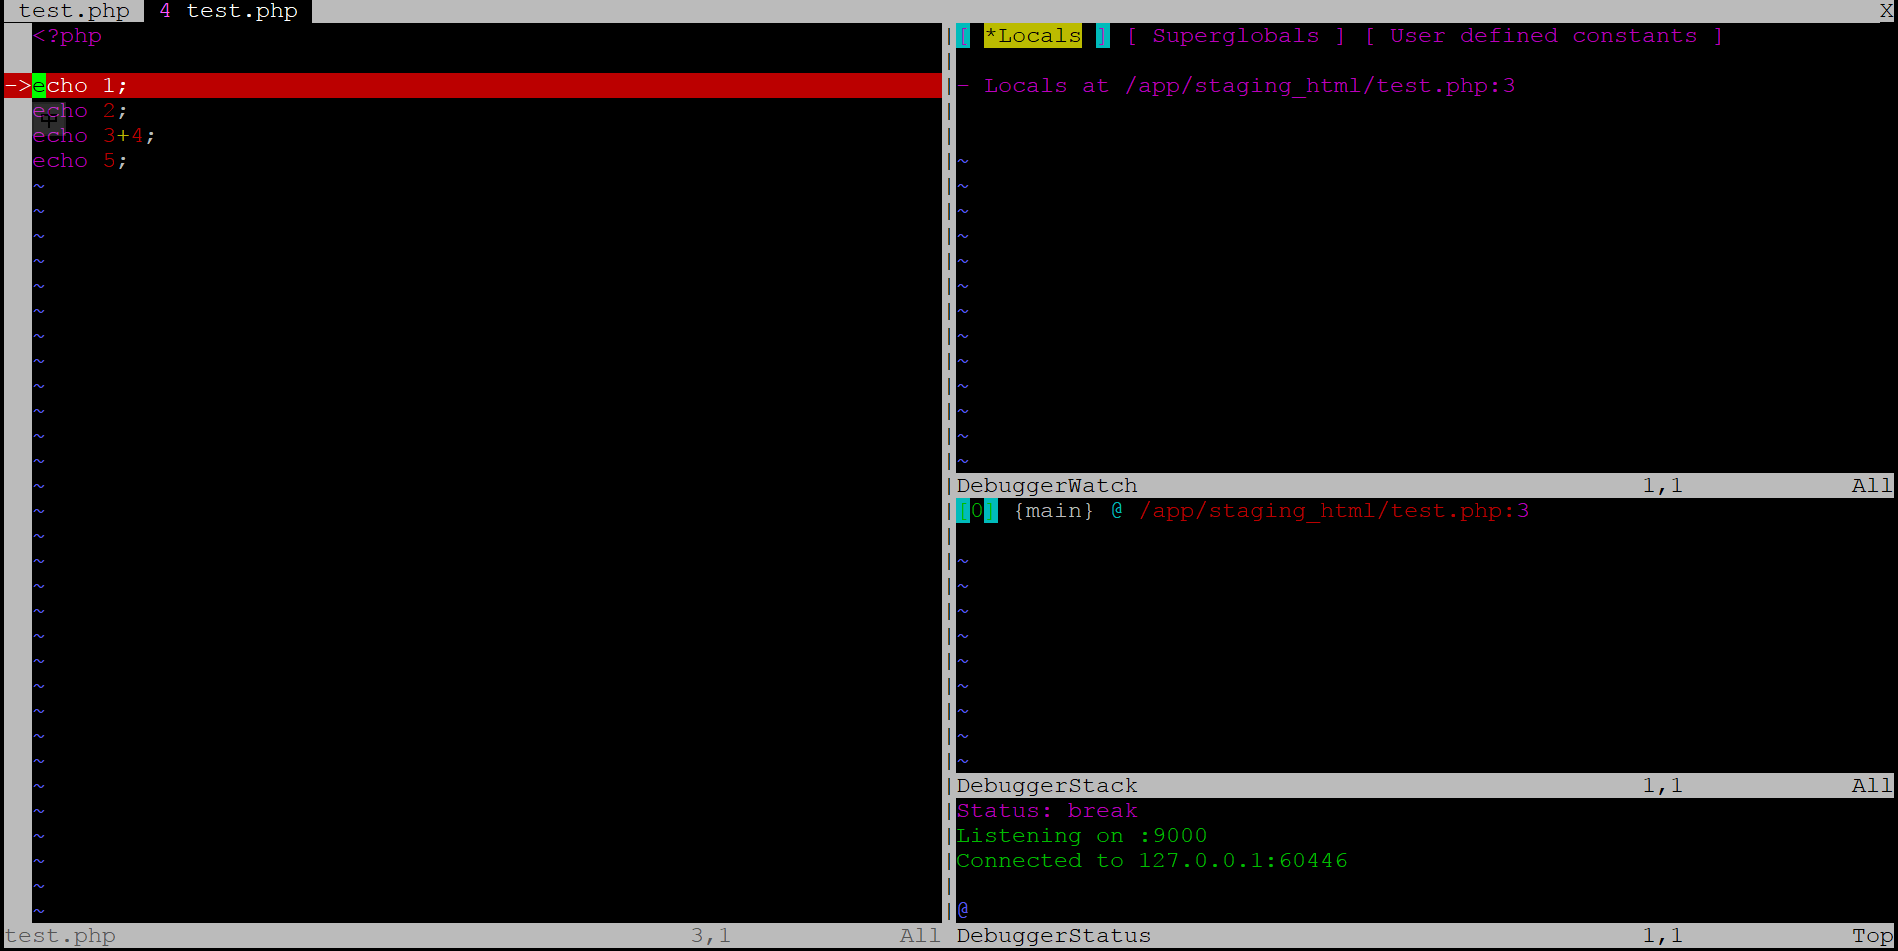
14. You could now step over and check the variable status. Here are some quick debug instructions:
<F5>: start/run (to next breakpoint/end of script)

<F2>: step over

<F3>: step into

<F4>: step out

<F6>: stop debugging (kills script)

<F7>: detach script from debugger

<F9>: run to cursor

<F10>: toggle line breakpoint

<F11>: show context variables (e.g. after "eval")

<F12>: evaluate variable under cursor

:Breakpoint <type> <args>: set a breakpoint of any type (see :help VdebugBreakpoints)

:VdebugEval <code>: evaluate some code and display the result

<Leader>e: evaluate the expression under visual highlight and display the result
15. Enjoy 🙂
Leave a comment